How Robotics Drive Efficiency and Resilience in Industry
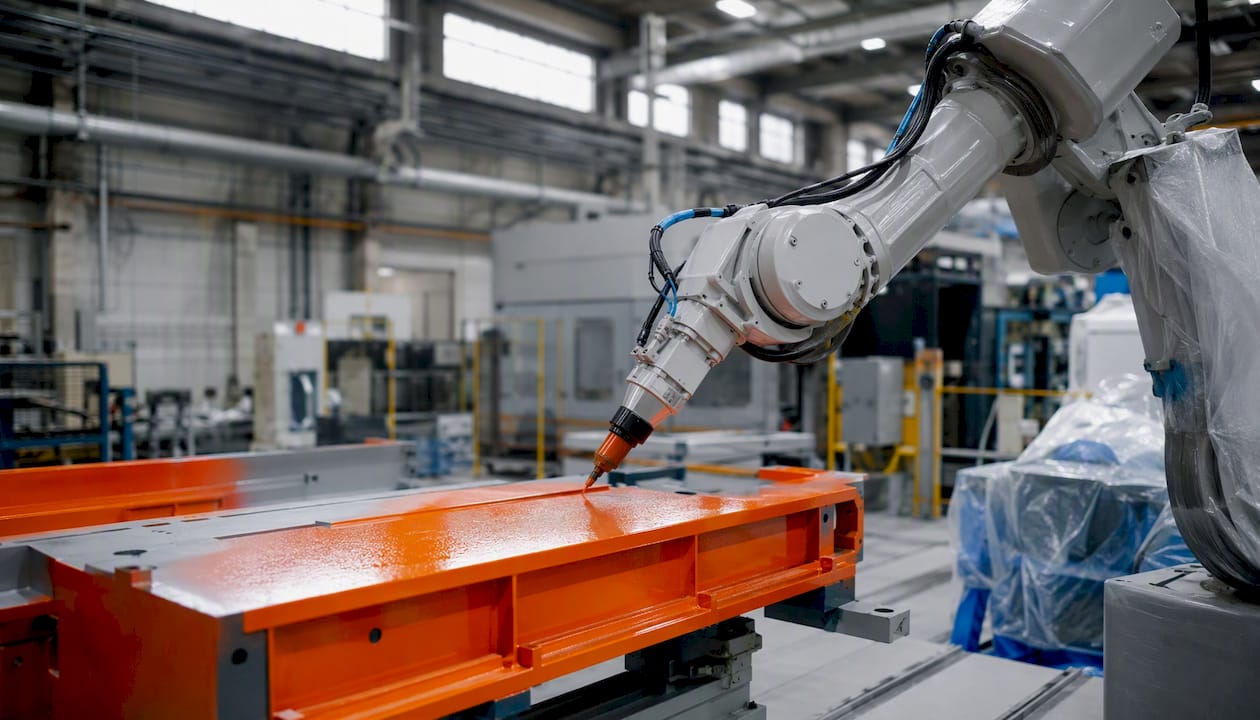
Robotics are a core productivity and resilience lever in modern manufacturing, and the scale of adoption makes that claim concrete: 542,076 industrial robots were installed globally in 2024, keeping annual installations above 500,000 for the second consecutive year. If you are a plant manager or operations leader weighing where to start, three moves matter most right now:
- Audit your highest-cost, highest-variability processes first — welding, palletizing, and inspection are where robots typically close the gap fastest.
- Scope a contained pilot with measurable KPIs before committing to a full cell installation.
- Model both purchase and Robotics-as-a-Service (RaaS) financing side by side; for many mid-market manufacturers, RaaS changes the math entirely.
The rest of this guide gives you the use cases, metrics, technology stack, implementation checklist, and trend signals to build a credible business case and move quickly.
Key Takeaways
| Point | Details |
|---|---|
| Scale of adoption | 542,076 robots installed globally in 2024; global density is 177 per 10,000 manufacturing employees. |
| Pilot before scaling | Scope one high-pain, well-defined process, set three KPIs, and run a 90-day pilot before committing to full deployment. |
| Budget integration fully | Hidden costs (layout, fencing, IT, integrator fees) routinely push total installed cost to 1.5–2x the robot purchase price. |
| RaaS for capital-constrained lines | RaaS converts capex to opex and suits variable-volume or rapid-scaling operations; compare it against purchase before deciding. |
| Workforce planning is non-negotiable | Robot adoption shifts labor toward higher-skill roles; train operators before installation, not after, to protect ramp-up speed. |
Table of Contents
- What roles do robots actually play in industry today?
- What measurable benefits and KPIs should you track?
- What does the robotics technology stack actually look like?
- How do you plan and implement a robotics project?
- What are the dual-track strategy and RaaS, and should you use them?
- What barriers will you face, and how do you get past them?
- What trends should shape your procurement and skills plans now?
- Real-world examples across industries
- Where should you actually start? Yslootahtech's perspective
- Sources
What roles do robots actually play in industry today?
The role of robotics in industry spans far more than the welding arms most people picture. Modern deployments break into three hardware categories, each suited to different problems.
Industrial robots (six-axis arms from makers like FANUC, ABB, KUKA, Yaskawa, and Universal Robots) handle high-speed, high-force, or high-precision tasks in physically separated cells. Collaborative robots (cobots), led commercially by Universal Robots and ABB's GoFa line, work alongside people without full safety guarding and excel at high-mix, low-volume tasks. Autonomous Mobile Robots (AMRs) and Automated Guided Vehicles (AGVs) move materials across a facility floor, replacing manual tuggers and forklifts.
The most common use cases across U.S. manufacturing today:
- Material handling and palletizing — the single largest application category; robots pick, place, and stack at speeds no human crew can sustain across a full shift.
- Arc and spot welding — consistent weld quality, zero fume exposure for workers, and cycle times measured in seconds rather than minutes.
- Machine tending and loading — a cobot or industrial arm feeds a CNC lathe or press 24 hours a day without fatigue.
- Assembly — from automotive sub-assemblies to electronics PCB placement, robots hold tolerances humans cannot.
- Inspection and quality control — vision-guided robots catch surface defects, dimensional errors, and label mismatches at line speed.
- Painting and coating — consistent film thickness, zero overspray waste, and no solvent exposure for workers.
- Packaging and case erecting — high-speed secondary packaging where labor turnover is historically brutal.
- Intralogistics (AMRs/AGVs) — warehouse and factory floor material flow, increasingly managed by fleet software rather than fixed routes.
Industry mapping gives you a quick sense of fit. Automotive plants use FANUC and KUKA arms for body-in-white welding and Yaskawa cells for paint shops. Electronics manufacturers rely on ABB and FANUC for PCB assembly and inspection, where the electronics sector accounts for 24% of global robot installations and automotive for 23%. Metal and machinery shops deploy machine-tending cobots from Universal Robots to run lights-out shifts. Food and beverage lines use hygienic-design AMRs for case movement and delta robots for pick-and-place portioning. Plastics and chemical plants favor vision-guided inspection arms to catch cosmetic defects before packaging.
What measurable benefits and KPIs should you track?
Decision-makers need numbers, not promises. The impact of robotics in manufacturing shows up across five KPI categories.
Throughput and cycle time are the most immediate signals. A robot running a welding cell at a fixed cycle time eliminates the variability that comes from shift changes, fatigue, and absenteeism. Overall Equipment Effectiveness (OEE) captures availability, performance, and quality in one number; robot-tended cells routinely push OEE above 85%, compared with 60–65% in manual operations. Scrap and yield rates are where the quality argument lands: company-level survey evidence shows robot adopters report higher productivity, lower scrap, and greater adoption of energy-efficient technologies compared with non-adopters. Labor hours per unit and takt time track the direct cost impact. ROI payback period is the executive metric; most cobot pilots in the U.S. target 12–24 months.
| KPI | Typical direction with robotics | Why it matters |
|---|---|---|
| Throughput / units per shift | Up | Direct revenue capacity |
| Scrap / defect rate | Down | Yield and rework cost |
| OEE | Up | Asset utilization |
| Labor hours per unit | Down | Unit cost reduction |
| Safety incidents | Down | Insurance and compliance |
| Energy use per unit | Down | Sustainability and cost |
| ROI payback period | typically ranges from one to three years | Capital justification |
At the macro level, robot capital deepening contributed roughly 11.8% of labor productivity growth over 1999–2019, with non-robot capital deepening remaining the largest single driver at 37.3%. That context matters for procurement: robots are a meaningful but not singular lever. A 52-country econometric study found that higher robot stock per employee correlates with lower unemployment and higher total factor productivity and real wages overall, while tending to reduce the employment ratio within manufacturing specifically. The practical read for a U.S. plant leader: automation typically shifts labor demand toward higher-skill roles rather than eliminating it outright, but workforce planning must be deliberate.
The global robot density benchmark sits at 177 robots per 10,000 manufacturing employees. If your facility is well below your sector's density, that gap is a competitive exposure, not just a missed efficiency opportunity.
What does the robotics technology stack actually look like?
Hardware is the visible layer, but the software and data stack underneath it determines whether a deployment delivers lasting value or becomes an expensive island.
Hardware layers
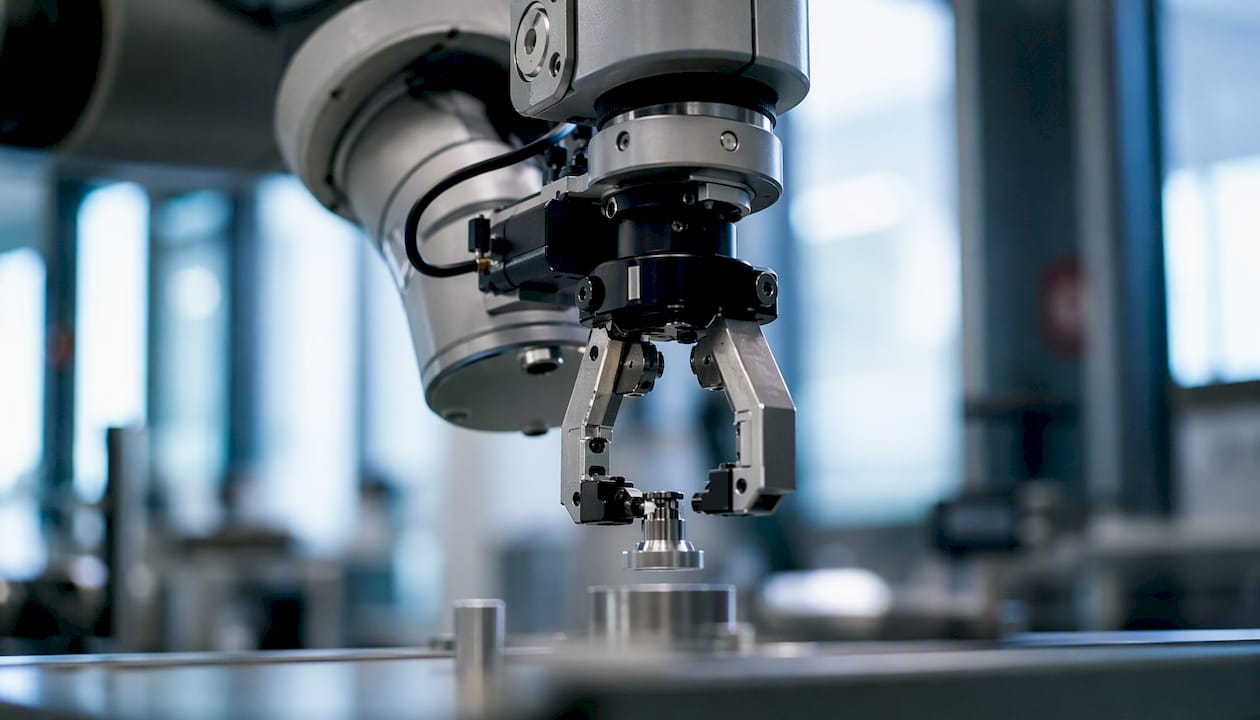
Industrial arms from FANUC, KUKA, ABB, and Yaskawa handle payloads from a few kilograms to over a ton, with repeatability measured in hundredths of a millimeter. Cobots from Universal Robots, ABB, and Yaskawa's HC series operate at lower speeds and payloads but require no safety cage when risk-assessed correctly. End effectors (grippers, welding torches, vision heads, dispensing nozzles) are often where the real application engineering lives; a robot arm is generic, but the end-of-arm tooling is task-specific. 2D and 3D vision systems from Cognex, Keyence, and others give robots the ability to locate parts, inspect surfaces, and guide assembly in unstructured environments.
Software and data layers
| Layer | Function | Common tools / standards |
|---|---|---|
| Robot controller / RTOS | Motion planning, safety monitoring | Vendor-native |
| PLC / SCADA | Machine-level logic and supervisory control | Siemens, Allen-Bradley |
| Vision software | Part location, inspection, OCR | Cognex VisionPro, Keyence CV-X |
| Fleet management (AMRs) | Route optimization, traffic management | Vendor platforms, VDA 5050 standard |
| MES / ERP integration | Production orders, traceability, OEE | SAP, Oracle, custom middleware |
| AI / ML inference (edge) | Adaptive control, predictive maintenance | NVIDIA Jetson, edge-deployed models |
| Digital twin | Simulation, commissioning, what-if analysis | Siemens Tecnomatix, NVIDIA Omniverse |
OT/IT integration is where most programs hit friction. Operational technology (PLCs, robot controllers, SCADA) runs on deterministic, latency-sensitive protocols; IT systems run on standard TCP/IP networks with different security models. Bridging them requires network segmentation, protocol translation (OPC-UA is the dominant standard), and a clear data governance policy. Off-the-shelf integration middleware works well when your equipment is from major vendors with standard interfaces; custom integration earns its cost when you have legacy equipment, proprietary protocols, or complex multi-vendor cells that no packaged connector handles cleanly.
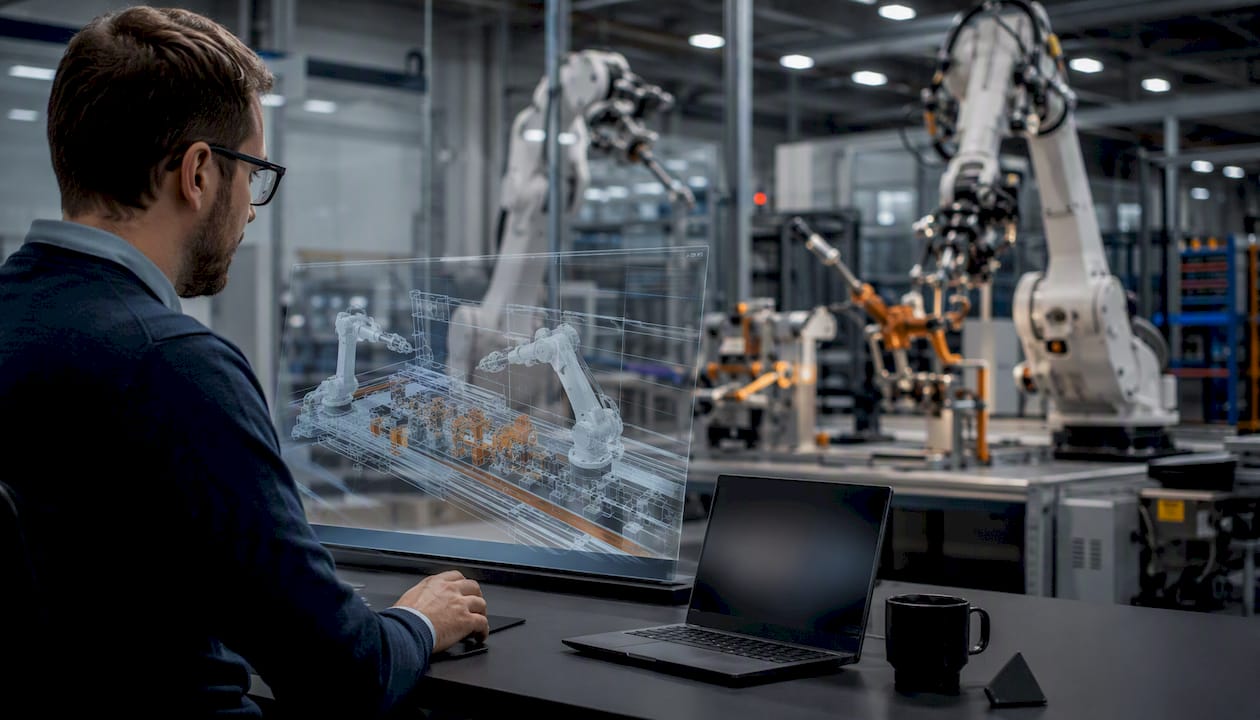
Digital twins deserve a specific mention. Simulation before physical commissioning can cut installation time by weeks and lets you test safety scenarios that would be dangerous to run live. The upfront investment in a twin pays back fastest on complex multi-robot cells and new facility layouts.
Pro Tip: Before choosing between a cobot and a high-speed industrial cell, calculate your required cycle time. If the task needs sub-5-second cycles or involves forces above 150N, a cobot will be the throughput bottleneck. High-mix, low-volume tasks with human handoffs are where cobots genuinely outperform a caged cell on total cost of ownership.
How do you plan and implement a robotics project?
A robotics program that stalls after the first purchase usually failed at scoping, not technology. Here is a practical sequence.
- Site audit and process selection. Map your top 10 processes by labor cost, defect rate, and injury frequency. Rank by automation feasibility (repeatability, part variability, access). The best pilot candidate is high-volume, well-defined, and currently causing measurable pain.
- Safety review and risk assessment. U.S. manufacturers follow ANSI/RIA R15.06 for industrial robots and ANSI/RIA R15.08 for mobile robots. A formal risk assessment before any cell design locks in guarding requirements, safety-rated stop functions, and operator SOP updates. Skipping this step creates liability and rework.
- Network and IT readiness check. Confirm OT network segmentation, available bandwidth for vision and fleet data, and cybersecurity baseline (MFA on OT access, firmware update policy, incident response plan).
- Integration partner shortlist. System integrators are often the real bottleneck; IFR data notes that integrator capacity constrains SME adoption more than robot availability. Shortlist two or three certified integrators early, not after purchase.
- Pilot KPI definition. Set specific targets before installation: target OEE, scrap rate, cycle time, and payback period. Without pre-defined KPIs, you cannot declare success or justify scale-up.
- ROI calculation. Collect: current labor cost per hour for the targeted process, estimated cycle-time reduction, scrap reduction value, utilization improvement, and full capex (robot, tooling, guarding, integration, training). Compare against a RaaS monthly fee covering the same scope. Yslootahtech's ROI-first guide walks through the financial model in detail.
- Workforce planning. Identify which roles shift (machine operators retrained as robot technicians), which roles are new (automation engineer, data analyst for OEE dashboards), and which training programs apply (community college robotics certificates, vendor training from FANUC, ABB, or Universal Robots).
Timeline benchmarks: A cobot pilot on an existing line typically runs 8–16 weeks from purchase order to production. A full industrial cell installation with custom tooling runs 16–36 weeks. An AMR fleet deployment across a facility floor runs 12–24 weeks depending on facility mapping complexity.
PwC's robotics in manufacturing guidance flags that hidden integration costs, including plant layout changes, safety fencing, and data infrastructure, frequently exceed the robot purchase price.
What are the dual-track strategy and RaaS, and should you use them?
The dual-track strategy is straightforward: run immediate automation projects to close current capacity and labor gaps while simultaneously building internal robotics and AI capabilities for long-term competitiveness. PwC frames this as the recommended approach for U.S. manufacturers who cannot afford to wait for a perfect technology roadmap before acting.
Track 1 (immediate automation) actions:
- Identify the two or three processes with the fastest ROI payback and deploy now.
- Use proven, well-supported platforms (FANUC, ABB, Universal Robots) to minimize integration risk.
- Set a 90-day post-deployment review against pilot KPIs.
- Capture lessons learned in a structured format before scaling.
Track 2 (capability building) actions:
- Hire or develop internal automation engineers and data analysts.
- Invest in AI/ML integration for predictive maintenance and vision-guided adaptive control. Combining AI with robotics is where the next productivity layer comes from.
- Pilot a digital twin for your highest-complexity cell.
- Engage with domestic robotics suppliers and integrators to reduce supply chain exposure.
RaaS (Robotics-as-a-Service) converts robot capital expenditure into a monthly operating expense. A vendor or integrator owns the hardware, handles maintenance, and charges per robot per month or per unit produced. IFR notes that RaaS and simpler programming interfaces are lowering barriers for SMEs that lack large upfront capital budgets.
RaaS works best when: your production volumes are variable, you need to scale up or down quickly, you lack internal maintenance capability, or your capital budget is constrained. It works less well for stable, high-volume lines where owned assets amortize faster. PwC noted over 44,000 industrial robot installations in the U.S. in 2023 alone, a volume that reflects both owned and RaaS deployments growing in parallel.
What barriers will you face, and how do you get past them?
Most robotics programs that underperform do so for predictable reasons.
- Upfront capex. A full industrial cell can run $150,000–$500,000 installed. Mitigation: use RaaS for the first deployment, or phase the program across fiscal years with a cobot pilot in year one.
- Hidden integration costs. Layout changes, safety fencing, IT infrastructure, and system integrator fees routinely push total cost well above the robot purchase price. Budget 1.5–2x the hardware cost for total installed cost on any first deployment.
- Skills gap. Most plants lack robot programmers and automation engineers on staff. Mitigation: partner with a system integrator for the first cell, then build internal capability through vendor training programs and community college partnerships.
- Cybersecurity and OT/IT risk. Robot controllers connected to plant networks are attack surfaces. Mitigation: segment OT networks, enforce MFA on remote access, maintain firmware update schedules, and include robotics in your incident response plan.
- Interoperability with legacy equipment. Older PLCs and proprietary machine protocols do not always speak OPC-UA. Mitigation: use protocol translation gateways, and factor legacy integration complexity into your integrator shortlist criteria.
Vendor-selection red flags to watch for: opaque total cost of ownership claims, no published integration support model, closed ecosystems with no standard API, and integrators who cannot provide reference customers in your industry.
Pro Tip: When budgeting a robotics project, add a line item for change management: operator training, SOP rewrites, and internal communication. Programs that skip this step see slower ramp-up and higher operator resistance, which delays the payback period more than any technical issue.
What trends should shape your procurement and skills plans now?
The 2–5 year horizon for robotics applications in industry is clearer than most technology forecasts, because the underlying drivers (labor costs, quality demands, supply chain resilience) are structural.
- Broader RaaS adoption will continue as more vendors offer subscription models, making high-end automation accessible to manufacturers with under $10M in annual revenue.
- Cobots in high-mix, low-volume lines will expand as payload and speed limits improve; Universal Robots and ABB are both pushing cobot envelopes toward tasks previously reserved for industrial arms.
- AI-driven vision and adaptive control will let robots handle part variability that previously required human judgment, opening up assembly and inspection tasks that are currently too unstructured to automate.
- Digital twins and simulation will become standard commissioning tools, not premium add-ons, as software costs fall and the ROI on pre-deployment simulation becomes undeniable.
- Edge compute will handle latency-sensitive inference (real-time vision, force control) locally, reducing dependence on cloud connectivity for safety-critical decisions.
- Improved human-robot interfaces (voice, gesture, AR-guided programming) will lower the skill floor for robot operation and reprogramming, reducing the specialist dependency that currently slows high-mix deployments.
For procurement, these trends mean shorter evaluation cycles (more off-the-shelf solutions), pay-for-performance contract structures (especially in RaaS), and a growing need to evaluate software and data capabilities alongside hardware specs.
On sustainability: the MDPI survey evidence linking robot adoption to greater use of energy-efficient technologies is a secondary benefit worth capturing in your ESG reporting. Reduced scrap, lower rework energy, and optimized material flow all contribute to a smaller production footprint.
Real-world examples across industries
These examples reflect documented deployment patterns across sectors. Specific financial figures are directional; your results will depend on process complexity, labor rates, and integration scope.
-
Automotive body shop (KUKA/FANUC industrial arms). Challenge: inconsistent weld quality and high rework rates on door panel assemblies. Solution: six-axis welding cells with vision-guided seam tracking. Outcome: weld defect rates dropped significantly, and the line ran lights-out on weekends, adding effective capacity without headcount.
-
Electronics PCB assembly (ABB/FANUC pick-and-place). Challenge: component placement errors causing downstream test failures. Solution: high-speed delta robots with integrated vision for placement verification. Outcome: first-pass yield improved materially, and the line throughput increased because manual inspection bottlenecks were removed.
-
Food and beverage case packing (Universal Robots cobots). Challenge: high turnover in end-of-line packing roles and repetitive strain injury claims. Solution: UR cobots deployed alongside remaining operators for case erecting and tray loading. Outcome: injury incidents on that line dropped to near zero, and the cobots paid back within 18 months at U.S. labor rates.
-
Metal fabrication machine tending (Universal Robots cobot). Challenge: a small-batch job shop could not justify a full industrial cell for CNC tending across multiple machines. Solution: a single mobile cobot on a cart, reprogrammed between machines using tablet-based interfaces. Outcome: the shop ran two additional shifts per week without adding headcount, and the RaaS model kept upfront cost under $3,000/month.
-
Warehouse intralogistics (AMR fleet). Challenge: a distribution center with high SKU variability could not route fixed AGVs efficiently as layouts changed. Solution: an AMR fleet using dynamic mapping and a VDA 5050-compliant fleet management system. Outcome: pick-to-ship cycle time dropped, and the fleet scaled from 10 to 40 units over 18 months without facility reconfiguration.
Where should you actually start? Yslootahtech's perspective
The most common mistake operations leaders make is waiting for the perfect business case before running a pilot. By the time every variable is modeled, a competitor has already captured the productivity gain and the labor market has tightened further.
Start with the problem, not the technology. Pick one process where the pain is measurable and the task is well-defined. A welding cell, a palletizing station, a CNC tending application. Define three KPIs before you buy anything. Then run the pilot for 90 days and let the data make the scale-up argument for you.
For vendor and partner selection, prioritize integrators with documented experience in your industry and ask for reference customers at similar production volumes.
Workforce planning is not optional. The 52-country research is clear that robot adoption shifts labor demand rather than eliminating it. Plan the retraining program before the robot arrives, not after. Operators who understand why the change is happening and have a clear path to a higher-skill role are your fastest route to a smooth ramp-up.
Yslootahtech works with manufacturers and industrial operators to scope pilots, design the software and data stack, and integrate robotics with existing MES and ERP systems. If you're at the stage of building a business case or selecting an integration model, Yslootahtech's robotics services and AI and machine learning capabilities are built for exactly this kind of end-to-end engagement.
Sources
- Executive Summary WR 2025 Industrial Robots (IFR)
- Robotics in manufacturing | PwC
- Effect of usage of industrial robots on quality, labor productivity, exports and environment | MDPI Sustainability
- The contribution of industrial robots to labor productivity growth and economic convergence: a production frontier approach | Journal of Productivity Analysis