Stop Losing $180,000 a Year: CFO Ready Software Project ROI Playbook

Software project ROI is the net financial return of a development investment divided by its total cost, expressed as a percentage. The formula is simple: ROI = (total benefits − total cost) ÷ total cost. What trips up most business cases isn't the math, it's the horizon. Use three to five years, not year one, and always pair simple ROI with payback period and net present value so finance sees both the risk and the reward. Start by nailing down total cost of ownership and one conservative benefits estimate before you touch a spreadsheet.
TL;DR:
- Most ROI models underestimate the importance of a three- to five-year horizon and pairing ROI with payback period and net present value.
- Accurate total cost of ownership should include build, infrastructure, enablement, ongoing maintenance, and opportunity costs, with consistent budgeting for updates and training.
- Benefits should be measured through baseline time audits, error rates, and soft proxies, with pilot testing to validate assumptions before full deployment.
- Presenting multiple options with specific KPIs and framing the cost of inaction significantly increases approval chances.
- Avoid common pitfalls by including full ongoing costs, modeling phased adoption, and ensuring transparency of assumptions in the business case.
Table of Contents
- What software project ROI actually measures (and the formulas behind it)
- Why ROI drives funding decisions and the cost of standing still
- Total cost of ownership: what belongs in the number
- Turning time savings and risk reduction into real numbers
- A worked example: five-year ROI, payback, and NPV
- How to build a business case executives will actually approve
- Tracking ROI after launch: KPIs, dashboards, and who owns what
- Where ROI projections go wrong
- How Yslootahtech applies ROI discipline to client engagements
- The playbook works, but only if you use it honestly
- Sources
What software project ROI actually measures (and the formulas behind it)
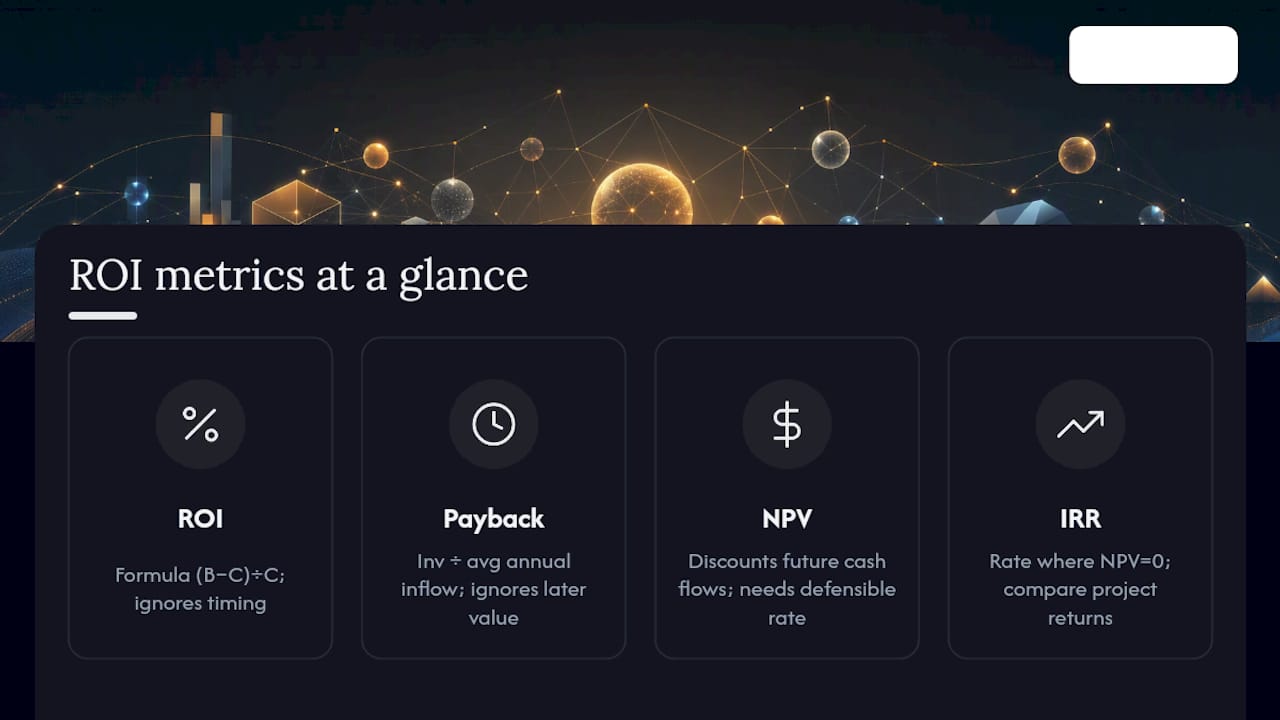
Simple ROI answers one question: for every dollar spent, how many dollars come back? The formula, ROI = (total benefits − total cost) ÷ total cost, gives you a single percentage that's easy to communicate but blind to timing. A project returning 150% over five years looks identical to one returning 150% over eighteen months, even though the second is far more valuable.
Payback period fixes part of that blind spot. It answers "when do we break even?" by dividing net investment by average annual cash inflow. CFOs gravitate toward this metric because it's concrete and low-risk to defend in a budget meeting.
Net present value (NPV) goes further by discounting future cash flows back to today's dollars, accounting for the time value of money and the fact that a dollar saved next year is worth less than a dollar saved today. Internal rate of return (IRR) is the discount rate at which NPV hits zero, useful for comparing projects of different sizes.
Each metric has a blind spot: simple ROI ignores timing, payback ignores value earned after breakeven, and NPV/IRR require a defensible discount rate. Match that rate to your company's weighted average cost of capital or a documented hurdle rate. Guessing at a discount rate is a common way ROI models lose credibility with finance.
Why ROI drives funding decisions and the cost of standing still
Different stakeholders read different numbers. A CFO scanning for downside risk usually locks onto payback period because it's concrete and testable. A board member weighing strategic bets wants NPV, because it captures total value creation, not just when the bleeding stops. If you present only one metric, you're gambling that it happens to be the one your audience trusts.
The more overlooked lever in a business case is the "do nothing" baseline. Every software decision has an implicit alternative: keep the current process, absorb the current error rate, keep paying the labor cost of manual work. Quantifying that ongoing cost reframes the entire conversation. Instead of asking "should we spend $400,000 on this system," the question becomes "should we keep losing $180,000 a year in duplicated data entry and missed invoices?" That framing consistently improves approval odds because inaction stops looking free.
Present multiple options rather than a single yes/no ask. A pilot-scale option, a standard build, and a full-featured version each tied to specific, measurable outcomes gives decision-makers control over risk level instead of forcing an all-or-nothing vote. That structural shift, from approving a project to selecting among options, tends to move faster through committee.
Total cost of ownership: what belongs in the number
Most ROI models fail before the benefits side even enters the picture, because the cost side is incomplete. Total cost of ownership has to cover the full three-to-five year window, not just the build invoice.
Build and infrastructure costs:
- Development labor (internal or vendor), architecture, and design
- Third-party licenses, APIs, and platform fees
- Cloud hosting and data storage, scaled to expected usage
- Integration work connecting the new system to existing tools
Enablement costs:
- Data migration and cleaning from legacy systems
- Training time for end users and administrators
- Rollout communications and internal change management
Ongoing costs:
- Maintenance, patching, and technical support
- Security and compliance monitoring
- Incremental enhancements and feature requests after launch
- Opportunity cost: what your team could have built instead with the same hours
That last category gets skipped constantly, and it shouldn't. If your best engineers spend six months on an internal tool, that's six months they weren't spending on a customer-facing feature with its own revenue potential. A credible TCO estimate treats that tradeoff as a real cost, not a footnote.
Pro Tip: Build a recurring maintenance line into TCO from day one, and budget roughly 10 to 20 percent of the initial build cost annually for enhancements. Skipping this is the single fastest way a project that looked profitable on paper turns into a budget overrun eighteen months later.
Turning time savings and risk reduction into real numbers
Benefits split into two buckets: hard returns you can measure directly, and soft returns that need a proxy to become credible dollar figures. Both belong in the model, but they require different rigor.
Hard returns come from three sources: labor hours saved, revenue uplift, and capacity gains. The math for labor savings is straightforward: hours saved per week × loaded labor rate (salary plus benefits and overhead) × 52 weeks. Revenue uplift requires attribution rules agreed with sales and finance before the project starts, so nobody argues about causation after the fact. Capacity gains, like handling more transactions without adding headcount, get valued at the cost of the headcount you avoided hiring.
Soft returns are trickier but not unmeasurable. Customer satisfaction improvements can be tied to lifetime value if you have a documented relationship between NPS scores and retention in your business. Risk reduction, like fewer security incidents or compliance violations, gets valued using probability of occurrence multiplied by average cost of impact. Always monetize soft benefits conservatively, using the low end of any range, so the business case survives scrutiny.
A three-step measurement process makes this defensible:
- Run a time audit before the project starts to establish your baseline hours spent on the manual process.
- Track an error baseline, counting defects, rework, or missed deadlines under the current system.
- Measure a pilot or limited rollout against both baselines before scaling the ROI claim to the full deployment.
That pilot step matters more than most business cases admit. A short trial measuring a handful of KPIs converts a soft assumption into a number finance can actually check.
A worked example: five-year ROI, payback, and NPV
Assume a mid-size logistics company is replacing a manual dispatch process with a custom scheduling application. Scope: automate route assignment and customer notifications. Horizon: five years.
Costs (Year 0 and ongoing):
- Initial build: $220,000
- Data migration and training: $30,000
- Annual maintenance and hosting: $35,000 per year
- Year 3 enhancement budget: $25,000
Benefits, ramped by adoption:
- Labor savings from automated scheduling: $140,000 per year at full adoption, but realized at 40% in Year 1, 75% in Year 2, and 100% from Year 3 onward
- Reduced late-delivery penalties: $30,000 per year, same adoption ramp
Running the numbers year by year:
Simple ROI over five years: total benefits ($705,500) minus total cost ($450,000), divided by total cost, equals roughly 57%. Payback lands between Year 3 and Year 4, around 3.1 years. Discounting those net cash flows at 8% produces an NPV of approximately $155,000, still comfortably positive even after accounting for the time value of money.
Run a sensitivity check before presenting this. If benefits come in 20% lower than projected, NPV drops but stays positive. That range, not a single confident number, is what makes an ROI estimate defensible in front of a skeptical CFO.
How to build a business case executives will actually approve
A one-page executive summary beats a forty-slide deck every time. Structure it around four elements decision-makers scan for first: the cost of inaction, the recommended option, expected ROI, and payback period. Bury any of those four and you'll get sent back for round two.
Build the case in this order:
- State the cost of doing nothing first. Quantify the current-state losses, whether that's manual labor hours, error-driven rework, or missed revenue, in annual dollar terms.
- Present two or three investment tiers. A pilot option at lower cost and lower risk, a standard build, and a full-scope version each with its own ROI and payback figure.
- Show the recommended path with its numbers. State simple ROI, payback period, and NPV for the option you're actually asking approval for.
- List assumptions explicitly. Discount rate, adoption ramp, loaded labor rate, and any benefit proxies used should be visible, not buried in an appendix.
- Show sensitivity. A brief range (best case, base case, worst case) demonstrates the model survives scrutiny rather than depending on one rosy assumption.
- Name an owner and success KPIs. Every business case needs a named person accountable for realizing the benefits, plus the specific metrics that will confirm the project delivered.
Skipping the "do nothing" framing is the most common mistake in business cases that stall in committee. Decision-makers weigh a request against inaction by default. Naming the price of inaction, whether that's $180,000 a year in duplicated work or a compliance exposure that scales with growth, does that reframing for them instead of leaving it to guesswork.
Tracking ROI after launch: KPIs, dashboards, and who owns what
The business case doesn't end at go-live. Most realized ROI diverges from projected ROI within the first year, and the only way to catch that early is a measurement cadence that starts the day the system ships.
Track a focused set of KPIs rather than everything the system can technically report:
- Time saved per task, measured against the pre-launch baseline
- Error rate or defect count, compared to the documented baseline
- Revenue influenced, using the attribution rules agreed before launch
- System utilization and adoption rate by cohort or department
- Support ticket volume as a proxy for usability friction
Dashboards should differ by audience. Finance wants a rolling view of realized savings versus projected savings, updated monthly, with variance flagged.
Governance matters as much as the dashboard itself. Assign a named owner accountable for the ROI number, not just the delivery timeline. Set a reporting cadence, quarterly at minimum for the first two years. Define acceptance criteria per rollout cohort so partial adoption doesn't get quietly counted as full success. When the numbers diverge from plan, have a pre-agreed course-correction step, whether that's additional training, a feature adjustment, or a hard look at whether the adoption assumption was wrong from the start.
Where ROI projections go wrong
Three mistakes account for most of the gap between projected and realized ROI, and all three are avoidable.
Underestimating maintenance. A project that looks like a one-time $200,000 investment is rarely just that. Ongoing patching, security updates, and support consume real budget every year after launch, and models that omit an annual maintenance line consistently overstate ROI. Build that line into TCO from the start, not as an afterthought once the bills start arriving.
Real adoption ramps: some users resist, some need training, some departments move faster than others. Model that ramp explicitly, with a percentage adjustment per year, and budget for change management, communications, and training as real costs, not soft extras.
Over-engineering the build. Feature creep drives up both TCO and timeline without a proportional benefit increase. Every feature should map to a measurable outcome in the business case. If a feature doesn't move a tracked KPI, it's a cost without a corresponding entry on the benefits side of the ledger, and that math never works in the project's favor.
The fix for all three is the same: prefer iterative pilots and milestone gating over a single big-bang delivery. A phased approach lets you validate assumptions with real usage data before committing the full budget, and it catches adoption and scope problems while they're still cheap to fix.

How Yslootahtech applies ROI discipline to client engagements
Yslootahtech's discovery process starts by quantifying the status quo before proposing a build. That means measuring current-state costs, whether that's manual processing hours, error rates, or missed revenue, before scoping a solution, so the eventual business case has a real baseline instead of a guess.
Pilot phases follow the same logic outlined above: a limited rollout measured against agreed KPIs, converting assumed benefits into verified numbers before a client commits to full-scale investment. This approach shows up across custom software projects where phased delivery and milestone gating protect the client's budget while the ROI case gets tested with real usage data.
For teams evaluating whether custom-built software clears the bar over off-the-shelf alternatives, Yslootahtech's guidance on efficiency gains from tailored systems walks through how measurable outcomes get defined before a single line of code is written. Revenue-focused engagements can also benefit from a structured revenue leak assessment to quantify losses a new system is meant to close.
The playbook works, but only if you use it honestly
Most ROI models fail not because the formulas are wrong, but because the inputs are optimistic. That's the real gap between what ROI promises on a slide and what a finance team can actually verify eighteen months later.
The conventional advice, "just calculate ROI," undersells how much of this work is really about credibility, not math. A defensible business case shows its assumptions, models adoption as a ramp instead of a switch, and presents payback and NPV side by side because different people in the room trust different numbers.
If you take one thing from this, prioritize the "do nothing" baseline before you build the rest of the model. Quantifying the cost of inaction does more to move an approval than a more precise ROI percentage ever will, because it changes what the decision-maker is actually comparing against.
— YS