Why Data Drives Business Strategy: An Executive Guide

Data should sit at the center of your business strategy because it converts uncertainty into measurable, repeatable decisions. That's not a philosophy — it's the operational shift that separates organizations that grow predictably from those that react to surprises. Gartner recommends moving data and analytics from a decision-support function to an active decision-making peer — meaning your analytics team doesn't just report what happened; it shapes what happens next.
The single best first step: appoint a business-aligned data sponsor (a senior leader who owns both the business outcome and the data initiative) and launch a 90-day pilot on one high-value use case. Not a technology audit. Not a data catalog project. One use case with a measurable business KPI attached.
A strong 90-day pilot includes:
- A named business owner with a specific revenue, cost, or retention target
- A defined data scope (what data you already have vs. what you need to acquire)
- A baseline metric captured before the pilot starts
- A weekly review cadence with a cross-functional team (not just IT)
- Model error logging from day one — not as an afterthought
Pro Tip: Capture model error data from the first week of your pilot. Most teams skip this and lose the feedback signal that would have made their second model dramatically better. That error log is the seed of your compounding improvement flywheel.
Table of Contents
- What does a data-driven business strategy actually mean?
- What are the core components you need to build?
- How does data change your business outcomes?
- What does a 6-step roadmap from pilot to scale look like?
- What challenges will you face, and how do you overcome them?
- Which KPIs actually prove ROI from data initiatives?
- How are organizations using data to reshape strategy right now?
- Should you hire a partner or build this capability in-house?
- Key Takeaways
- The case for moving now, not later
- Useful sources and further reading
What does a data-driven business strategy actually mean?
A data-driven business strategy is the deliberate alignment of data collection, analytics, and governance with specific business goals — so that decisions at every level are informed by evidence rather than intuition. The key word is alignment. DAMA International warns that treating data projects as isolated IT initiatives prevents organizations from realizing any return; a formal enterprise data strategy is what makes data a strategic asset rather than a departmental expense.
What it is not: a BI dashboard rollout, a data lake migration, or a machine learning proof of concept that never reaches production. Those are maintenance activities or tactical experiments. A genuine data strategy ties every data capability — AI models, data governance frameworks, integration pipelines — to a business outcome you can measure in dollars, percentage points, or customer behavior.
Common misconceptions to avoid:
- "We have data, so we're data-driven." Having data and using it strategically are different things.
- "This is an IT project." Data strategy is a business strategy decision; IT executes it.
- "We need to clean all our data before we start." Perfect data is a myth. Start with good-enough data on a scoped use case.
- "Analytics means dashboards." Descriptive reporting is the floor, not the ceiling. Predictive and prescriptive analytics are where strategy lives.
One important legal note for US-based organizations: data usage must comply with applicable federal and state privacy regulations, including HIPAA for health data and the California Consumer Privacy Act where applicable. Governance isn't optional — it's a legal requirement that shapes what data you can collect, store, and act on.
What are the core components you need to build?
Databricks frames a complete data strategy as covering the full data life cycle — collection through governance through usage — and argues that without this end-to-end view, organizations cannot safely scale analytics or train AI models. Here's what that looks like in practice:
- Strategic vision and alignment. Every data initiative maps to a named business goal. Without this, you fund projects that generate insights nobody acts on.
- Data collection and integration. Pulling data from CRM, ERP, web, and operational systems into a unified view. Fragmented sources produce fragmented decisions.
- Governance and quality. Defined ownership, data contracts, and quality standards. Data lineage and quality controls are what keep your models trustworthy and your compliance posture clean.
- Storage and platform architecture. A centralized data estate — data lake, lakehouse, or warehouse — that serves as a single source of truth. Moving from batch to real-time event processing can capture significantly more usable data and accelerate time-to-insight.
- Analytics and models. Descriptive analytics tells you what happened. Predictive tells you what will happen. Prescriptive tells you what to do. Most organizations stop at descriptive.
- Operationalization and decision workflows. Getting model outputs into the hands of the people who make decisions — in the tools they already use, at the moment they need it.
- Data literacy and change management. The component most organizations underfund. Tableau's research is direct: technology alone won't convert raw information into strategic insights. People need to know how to read, question, and act on data.
Run a capability assessment against these seven components before you build a roadmap. Prioritize the two or three with the highest gap relative to your most valuable use cases — not the ones that are easiest to fix.
How does data change your business outcomes?
The business case for data-driven decision making comes down to five categories of measurable impact.

Faster, more confident decisions. When decisions rest on evidence rather than intuition, they move faster and hold up better under scrutiny. Leaders stop waiting for the quarterly review and start acting on weekly signals.
Revenue growth through personalization. Customer data — purchase history, behavioral signals, support interactions — feeds recommendation engines and targeted offers that lift conversion and average order value. Starbucks, for example, uses its rewards program data to personalize offers at scale, driving repeat purchase behavior across millions of customers.
Cost reduction through process optimization. Analytics applied to operations surfaces waste that's invisible to the naked eye: excess inventory, underutilized capacity, process steps that add time but not value. Advanced analytics applied to supply chain and manufacturing has consistently produced measurable reductions in cost per transaction.
Improved forecasting and risk reduction. Predictive models applied to demand, churn, or credit risk let you act before a problem becomes a crisis. That's the difference between proactive and reactive strategy.
New revenue from data products. Organizations that build proprietary data assets — a unique corpus of customer behavior, operational performance, or market signals — can monetize that data directly or use it to create products competitors cannot replicate.
"Insights-driven businesses are stealing your customers." — Forrester Research
Forrester's research on insights-driven businesses makes the competitive threat concrete: companies that systematically use data to guide strategy grow faster and take share from those that don't. The gap compounds over time because proprietary data gets richer with every customer interaction.
What does a 6-step roadmap from pilot to scale look like?
A practical path from decision to deployed capability runs through six steps. The first three fit inside 90 days; the last three take you to 180 days and beyond.
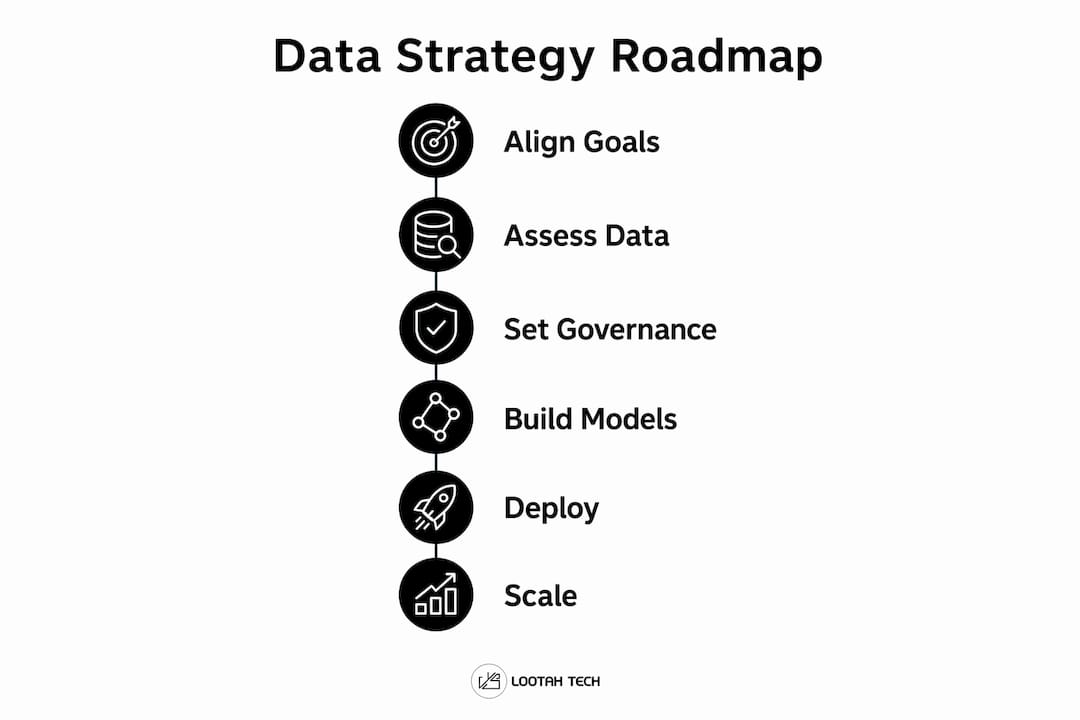
Step 1 — Align on goals and select your use case (Weeks 1–2). Pick one use case where the business pain is real, the data is mostly available, and a measurable KPI exists. Demand forecasting, churn prediction, and pricing optimization are common starting points.

Step 2 — Assess data readiness (Weeks 2–4). Map what data you have, where it lives, and what's missing. Identify integration gaps and assign a data owner for each source.
Step 3 — Establish governance guardrails (Weeks 3–6). Define access controls, data quality standards, and a privacy review before you build anything. Retrofitting governance is far more expensive than building it in.
Step 4 — Build and validate your first model (Weeks 4–10). Develop a minimum viable model, test it against a holdout dataset, and validate outputs with the business owner — not just the data team.
Step 5 — Deploy and operationalize (Weeks 10–12). Integrate model outputs into existing workflows. Track adoption rate alongside model accuracy. A model nobody uses has zero business value.
Step 6 — Measure, learn, and scale (Months 4–6). Review KPIs against baseline. Capture model errors systematically. Use what you learn to prioritize the next use case and expand the platform.
90-day pilot checklist:
- Named business owner with a specific KPI target
- Data inventory completed and gaps documented
- Governance policy drafted and reviewed
- Baseline metric captured and agreed upon
- First model in validation by Day 60
- Adoption metric defined before deployment
Broad cost signals: A scoped 90-day pilot with an external partner typically runs from tens of thousands to low six figures depending on data complexity and team size. Internal builds cost less in cash but more in time and opportunity cost. Budget for change management — training and communication — at roughly 20–30% of the technology spend.
For a structured approach to aligning technology with business goals, a digital transformation roadmap provides a useful framework to sequence investments.
What challenges will you face, and how do you overcome them?
Most data strategy initiatives stall on the same five problems.
- Data quality and silos. Inconsistent definitions, duplicate records, and data locked in departmental systems are the most common blockers. Mitigation: establish data contracts between teams that define format, frequency, and ownership before integration begins.
- Cultural resistance and low data literacy. People resist what they don't understand or what threatens their judgment. Mitigation: train managers to read and question data outputs, not just consume them. Budget training alongside technology from day one, as Tableau's guidance explicitly recommends.
- Governance and security concerns. Broad data access without controls creates compliance risk. Mitigation: define data ownership roles and security guardrails before democratizing access. This is especially critical in regulated industries under HIPAA or state privacy laws.
- Technology complexity. Too many tools, too little integration. Mitigation: start with the platform you already have. Add specialized tools only when a specific capability gap is proven, not anticipated.
- Talent and resourcing gaps. Data scientists are expensive and scarce. Mitigation: hire for business-aligned analytics skills first, not pure data science. A business analyst who understands your domain and can work with modern BI tools often delivers more value faster than a PhD who doesn't know your customers.
Pro Tip: The most common strategic mistake is letting tool selection drive strategy. A vendor demo should never precede a use-case definition. Decide what decision you want to improve, then find the tool that supports it — not the other way around.
Which KPIs actually prove ROI from data initiatives?
Outcome KPIs tell you whether the business moved. Leading operational KPIs tell you whether your data capability is working. You need both.
For enterprise analytics and reporting, the most useful KPIs are those that connect directly to a financial or customer outcome — not just to data volume or model performance in isolation.
| KPI | What it measures | How to measure | Reporting cadence |
|---|---|---|---|
| Revenue lift from personalization | Incremental revenue from data-informed offers | A/B test vs. control group | Monthly |
| Cost per transaction | Operational efficiency improvement | Process cost before vs. after | Quarterly |
| Customer lifetime value (CLV) | Long-term revenue impact of retention improvements | Cohort analysis | Quarterly |
| Time-to-insight | Speed of analytics delivery | Days from data request to decision | Monthly |
| Model accuracy (precision/recall) | Quality of predictive outputs | Holdout dataset validation | Weekly during deployment |
| Data adoption rate | Percentage of decisions using data outputs | Usage logs from BI/analytics tools | Monthly |
On attribution: proving that an analytics initiative caused a business outcome requires more than correlation. Use A/B testing for customer-facing changes, champion-challenger frameworks for operational decisions, and causal inference methods (difference-in-differences, regression discontinuity) when randomized tests aren't feasible. The attribution method should be agreed upon before the pilot starts — not after results come in.
How are organizations using data to reshape strategy right now?
Demand forecasting in retail. A mid-size retailer facing chronic overstock and stockout problems integrated point-of-sale data, weather signals, and promotional calendars into a demand forecasting model. The strategic objective was margin improvement. The outcome: inventory carrying costs dropped and in-stock rates on high-velocity SKUs improved, directly lifting gross margin. The model error log revealed that promotional timing was the single biggest driver of forecast variance — a finding that changed how the marketing team planned campaigns.
Churn prediction in financial services. A financial services firm used transaction behavior, support call frequency, and product usage data to build a churn propensity model. Rather than waiting for customers to cancel, relationship managers received weekly lists of at-risk accounts with suggested interventions. Retention rates on targeted accounts improved measurably within two quarters.
Pricing optimization in B2B. A B2B manufacturer discovered through price elasticity modeling that roughly 30% of its product catalog was systematically underpriced relative to willingness-to-pay signals in the market. A data-informed repricing of that segment produced a margin lift without meaningful volume loss.
Building a strategic data core. IMD's research describes the most durable competitive advantage as a proprietary data corpus enriched by external pipelines and AI agents, with a feedback loop that captures model errors to improve models over time. One technology company built exactly this: a curated internal knowledge base, enriched with third-party market data, with automated agents enforcing data quality. The feedback loop meant every model failure made the next model better. That compounding effect is what separates a data project from a data strategy.
For more on how big data creates strategic differentiation, the pattern across industries is consistent: the organizations that win are those that treat their data as a proprietary asset, not a byproduct.
Should you hire a partner or build this capability in-house?
The honest answer depends on four variables: how fast you need results, how mature your internal capability is, how proprietary the IP needs to be, and what your cost horizon looks like.
Signals that favor hiring a partner:
- You need a working pilot in under 90 days and don't have a data engineering team
- Your use case touches a regulated domain (healthcare, finance) where compliance expertise matters
- You want to validate a business hypothesis before committing to a full internal build
- Your growth strategy involves M&A or geographic expansion, where data strategy must adapt quickly to new systems and data assets
Signals that favor building in-house:
- The data and the models are core proprietary IP — your competitive moat depends on owning them
- You have the talent and a 12-plus month runway to build without urgency
- The use case is deeply embedded in your operational processes and requires continuous iteration
Most organizations benefit from a hybrid: hire a partner to build and deploy the first use case, with explicit knowledge transfer milestones written into the contract. The goal is to own the capability by the end of the engagement, not to remain dependent on the vendor.
Pro Tip: Structure vendor contracts with phased delivery and knowledge transfer gates — not just deliverable milestones. Require that your internal team co-builds every component. A vendor who resists this is optimizing for dependency, not your success.
Key Takeaways
Data drives business strategy because it converts uncertainty into repeatable, measurable decisions — and organizations that build this capability early compound their advantage faster than late movers can close.
| Point | Details |
|---|---|
| Start with one use case | Pick a high-value use case with a measurable KPI and a named business owner before touching any technology. |
| Governance comes first | Define data ownership, access controls, and quality standards before scaling access or building models. |
| Culture is the hardest part | Budget training and change management at roughly 20–30% of technology spend — literacy gaps kill more initiatives than bad data does. |
| Measure outcomes, not activity | Track revenue lift, CLV, and cost per transaction — not data volume or model count. |
| Capture model errors from day one | The error log from your first pilot is the seed of your compounding improvement flywheel. |
The case for moving now, not later
The organizations that will own their markets in five years are building their data cores today. Not because data is fashionable, but because proprietary data compounds. Every customer interaction, every model error captured, every external signal integrated makes the next decision better than the last. Competitors who start this flywheel 18 months ahead of you don't just have better data — they have a structural advantage that grows faster than you can replicate it.
The leaders who wait for a "perfect" data foundation before acting are making a strategic error. The foundation improves through use, not through planning. A scoped pilot on one high-value use case, run with discipline and a clear KPI, teaches you more about your data maturity than any audit ever will.
Yslootahtech works with organizations across industries to design and build data-driven capabilities — from initial use-case definition through model deployment and operationalization. If you're considering where to start, the 90-day pilot framework in this guide is the right entry point. The question isn't whether your organization needs a data strategy. It's whether you start building it this quarter or cede the ground to someone who already has.
Useful sources and further reading
- Gartner — Data and Analytics Strategy: Gartner's framework for positioning D&A as a core business function, including the DASOM model for measuring strategic alignment and business value.
- DAMA International — Why Does Your Organization Need a Data Strategy?: The professional body for data management makes the enterprise case for formal data strategy and explains why siloed projects fail to scale.
- IMD — Your Data Strategy Won't Create Competitive Advantage. These Four Moves Will: The clearest articulation of the strategic data core concept, including the model-error feedback loop that creates compounding advantage.
- Databricks — Data Strategy: Why It Matters and How to Build One: Practical guidance on end-to-end data strategy covering governance, ML enablement, and data democratization with real implementation examples.
- Tableau — Data-Driven Decision-Making: Covers the cultural and literacy dimensions of becoming data-driven — the component most technology-focused guides underweight.
- Dataversity — When Business Growth Strategy Drives Data Strategy: Explains how to tailor your data priorities to your growth route — M&A, organic, or geographic expansion — rather than applying a generic framework.
- Forrester — Insights-Driven Businesses Are Stealing Your Customers: The competitive threat framing that makes the urgency of data strategy concrete for executive audiences.
- Coursera — What Is Data-Driven Decision-Making?: A clear primer on DDDM process steps, analytics types, and KPI measurement — useful for building internal literacy programs.